赶上要汇报几个数据接口的增长,几组千万级的数字变化写在文档里描述起来不太直观,于是就想画个简单的图吧,可手头的 mac 上没装 excel,于是就干脆把数据导出到文本里,用 python 读取文本简单出个图,这样以后还能在此基础上加一个筛选数据到文本的功能,合起来就是一个简单的报表接口,方便以后自己工作使用
pip3 install numpy
pip3 install scipy
pip3 install matplotlib
AlfreddeMacBook-Pro:~ alfred$ pip3 install numpy
Collecting numpy
  Downloading https://files.pythonhosted.org/packages/81/14/6d7c914dac1cb2b596d2adace4aa4574d20c0789780f1339d535e69e271f/numpy-1.18.2-cp37-cp37m-macosx_10_9_x86_64.whl (15.1MB)
    100% |████████████████████████████████| 15.1MB 873kB/s
Installing collected packages: numpy
Successfully installed numpy-1.18.2
AlfreddeMacBook-Pro:~ alfred$ pip3 install scipy
Collecting scipy
  Downloading https://files.pythonhosted.org/packages/85/7a/ae480be23b768910a9327c33517ced4623ba88dc035f9ce0206657c353a9/scipy-1.4.1-cp37-cp37m-macosx_10_6_intel.whl (28.4MB)
    100% |████████████████████████████████| 28.4MB 972kB/s
Requirement already satisfied: numpy>=1.13.3 in /usr/local/lib/python3.7/site-packages (from scipy) (1.18.2)
Installing collected packages: scipy
Successfully installed scipy-1.4.1
AlfreddeMacBook-Pro:~ alfred$ pip3 install matplotlib
Collecting matplotlib
  Downloading https://files.pythonhosted.org/packages/0d/61/b741990b429341bac1af5f5c645ee7aaa3bbe7daf3418d283c92c4b5ee82/matplotlib-3.2.1-cp37-cp37m-macosx_10_9_x86_64.whl (12.4MB)
    100% |████████████████████████████████| 12.5MB 61kB/s
Collecting kiwisolver>=1.0.1 (from matplotlib)
  Downloading https://files.pythonhosted.org/packages/df/93/8bc9b52a8846be2b9572aa0a7c881930939b06e4abe1162da6a0430b794f/kiwisolver-1.1.0-cp37-cp37m-macosx_10_6_intel.macosx_10_9_intel.macosx_10_9_x86_64.macosx_10_10_intel.macosx_10_10_x86_64.whl (113kB)
    100% |████████████████████████████████| 122kB 59kB/s
Collecting cycler>=0.10 (from matplotlib)
  Downloading https://files.pythonhosted.org/packages/f7/d2/e07d3ebb2bd7af696440ce7e754c59dd546ffe1bbe732c8ab68b9c834e61/cycler-0.10.0-py2.py3-none-any.whl
Collecting python-dateutil>=2.1 (from matplotlib)
  Downloading https://files.pythonhosted.org/packages/d4/70/d60450c3dd48ef87586924207ae8907090de0b306af2bce5d134d78615cb/python_dateutil-2.8.1-py2.py3-none-any.whl (227kB)
    100% |████████████████████████████████| 235kB 178kB/s
Collecting pyparsing!=2.0.4,!=2.1.2,!=2.1.6,>=2.0.1 (from matplotlib)
  Downloading https://files.pythonhosted.org/packages/5d/bc/1e58593167fade7b544bfe9502a26dc860940a79ab306e651e7f13be68c2/pyparsing-2.4.6-py2.py3-none-any.whl (67kB)
    100% |████████████████████████████████| 71kB 154kB/s
Requirement already satisfied: numpy>=1.11 in /usr/local/lib/python3.7/site-packages (from matplotlib) (1.18.2)
Requirement already satisfied: setuptools in /usr/local/lib/python3.7/site-packages (from kiwisolver>=1.0.1->matplotlib) (40.2.0)
Collecting six (from cycler>=0.10->matplotlib)
  Downloading https://files.pythonhosted.org/packages/65/eb/1f97cb97bfc2390a276969c6fae16075da282f5058082d4cb10c6c5c1dba/six-1.14.0-py2.py3-none-any.whl
Installing collected packages: kiwisolver, six, cycler, python-dateutil, pyparsing, matplotlib
Successfully installed cycler-0.10.0 kiwisolver-1.1.0 matplotlib-3.2.1 pyparsing-2.4.6 python-dateutil-2.8.1 six-1.14.0
第一行是列头,每列之间是用一个制表符分隔,粘贴过来格式有点乱。。数值做了处理,无含义,仅做示意
time        HLD_SUM   HLD_H     HLD_S
2020/03/23      7877591 3866496 4030043
2020/03/24      10581889        5117713 5598205
2020/03/25      9958516 4944698 5179602
2020/03/26      12769062        6144480	7021169
2020/03/27      13833847        6812746 7590811
2020/03/30      15265035        7666793 8107764
2020/03/31      20780601        10140789	      11492472
2020/04/01      28269005        14189980        15237823
2020/04/02      44910966        22775160        24256864
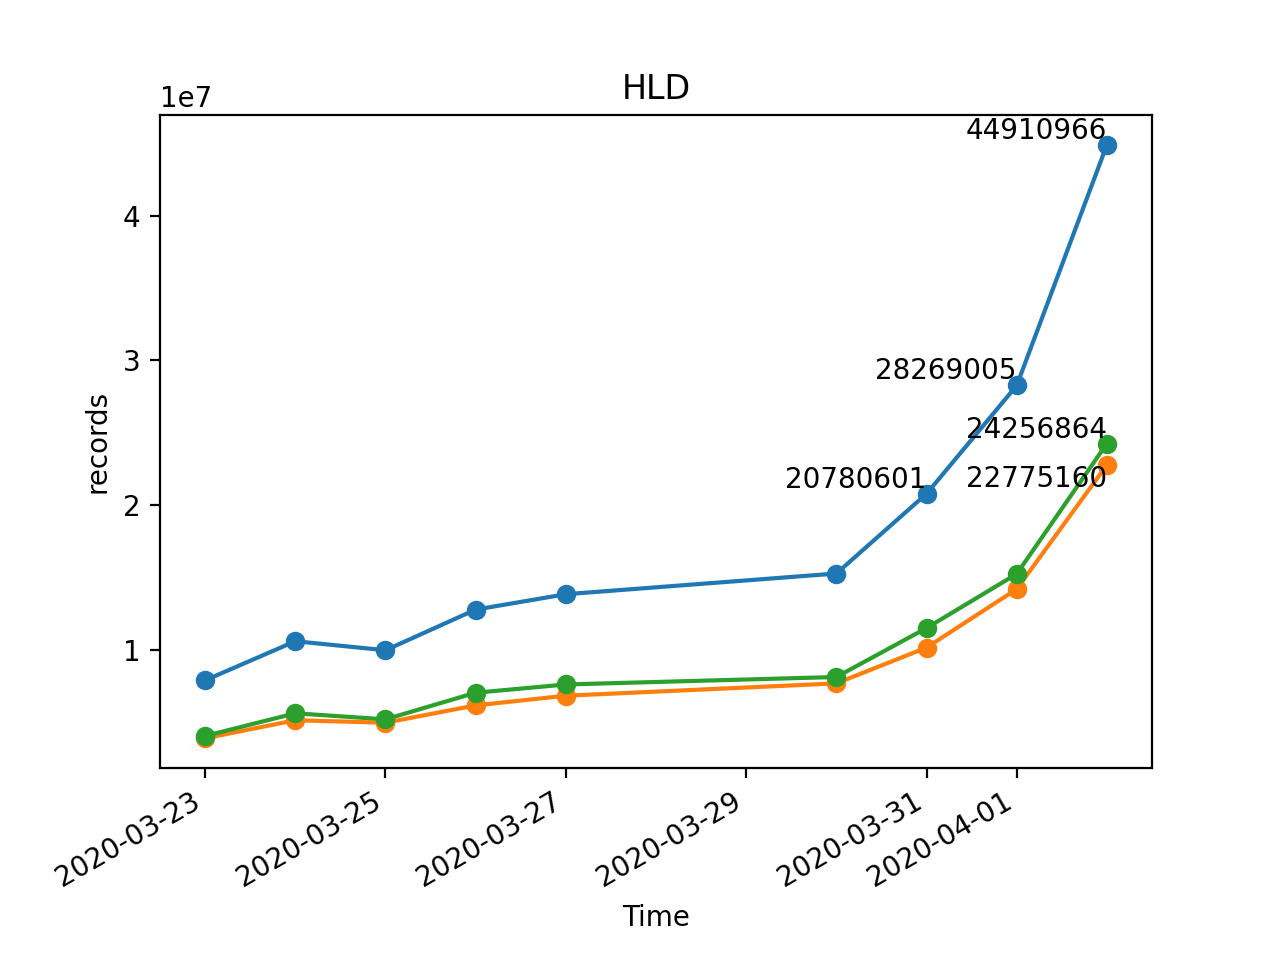
横轴为时间,可以把所有列的数据都绘制到一起,也可以 subplot 分别出图
from datetime import datetime
import matplotlib.pyplot as plt #引入绘图库


if __name__ == '__main__':

    # 打开文本文件 读取数据
    with open("nosql_statistic_new.txt",'r',encoding='utf-8') as f:
        data_lines = f.readlines()

    l_time    = []
    l_hld_sum = []
    l_hld_h    = []
    l_hld_s    = []


    num = len(data_lines)

    # ################
    #     整理数据
    # ################
    for i in range(1,num):
        line = data_lines[i]#从第1行开始[0行开始计数]
        if len(line) < 2:
            continue    #

        data = line.split('\t')
        time = data[0]
        # 使用最新日期的数据
        if len(l_time) != 0:
            if time == l_time[-1]:#如果这一行时间与上一行的时间相等,删除上一行数据
                print('删除上一行:' + time)
                l_time.pop(-1) #删除上一行记录的数据
                l_hld_sum.pop(-1)
                l_hld_h.pop(-1)
                l_hld_s.pop(-1)

        hld_sum = int(data[1])
        hld_h = int(data[2])
        hld_s = int(data[3])

        l_time.append(time)
        l_hld_sum.append(hld_sum)
        l_hld_h.append(hld_h)
        l_hld_s.append(hld_s)


    # ################
    #       画图
    # ################
    # X坐标,将str类型的数据转换为datetime.date类型的数据,作为x坐标
    xs = [datetime.strptime(d, '%Y/%m/%d').date() for d in l_time]

    plt.figure(1)
 #   plt.subplot(1, 3, 1)
    plt.title('HLD')
    plt.plot(xs, l_hld_sum, 'o-')
    plt.xlabel('Time')
    plt.ylabel('records')
    # 元素点 - 数据点在文字的↘右下,文字在↖左上
    plt.text(xs[-1], l_hld_sum[-1], l_hld_sum[-1], ha='right', va='bottom', fontsize=10)
    plt.text(xs[-2], l_hld_sum[-2], l_hld_sum[-2], ha='right', va='bottom', fontsize=10)
    plt.text(xs[-3], l_hld_sum[-3], l_hld_sum[-3], ha='right', va='bottom', fontsize=10)

 #   plt.subplot(1, 3, 2)
 #   plt.title('HLD_H')
    plt.plot(xs, l_hld_h, 'o-')
    plt.xlabel('Time')
 #   plt.ylabel('hld_h (records)')
    # 只画最后一个元素点 - 数据点在文字的↗右上,文字在↙左下
    plt.text(xs[-1], l_hld_h[-1], l_hld_h[-1], ha='right', va='top', fontsize=10)


 #   plt.subplot(1, 3, 3)
 #   plt.title('')
    plt.plot(xs, l_hld_s, 'o-')
 #   plt.xlabel('')
 #   plt.ylabel('')
    # 只画最后一个元素点 - 数据点在文字的↘右下,文字在↖左上
    plt.text(xs[-1], l_hld_s[-1], l_hld_s[-1], ha='right', va='bottom', fontsize=10)


    plt.gcf().autofmt_xdate()  # 自动旋转日期标记

    # show